
Mapping the Machine Mind: A Deep Dive into Context Graphs
🎧 Listen to this article
Prefer audio? Listen to Fumi read this article (11:52)
Hey everyone, Fumi here.
Let’s start with a scenario we’ve all learned to fear.
You’re sitting in the passenger seat of an autonomous taxi. It’s raining—not a torrential downpour, but that annoying, consistent drizzle that turns city lights into streaks on the glass. The car is navigating a busy intersection perfectly well, until suddenly, for no apparent reason, it slams on the brakes.
No pedestrian. No red light. No obstacle.
Your coffee spills. The car behind you honks. And the taxi just sits there, humming gently, as if it’s contemplating the meaning of life.
Later, the engineers pull the logs. They see *what* happened: the braking actuator fired at 14:02:35. They see the camera feed: a blurry reflection in a puddle. But the gap—the terrifying, frustating gap—is *why* the machine connected those two things. Did it think the puddle was a sinkhole? Did it think the reflection was a child? Or did a cosmic ray flip a bit in its decision tree?
For a long time, that gap was the price of admission for advanced AI. We called it the "Black Box" problem. We built systems so complex that even their creators couldn't fully trace the logic from input to output.
But as of this week, January 2026, the conversation is shifting. We aren't just looking at logs anymore; we are looking at maps. specifically, **Context Graphs**.
If you’ve been following the technical literature recently, you’ve probably seen this term popping up in papers about Agentic AI. It sounds like dry academic jargon, but it’s actually one of the most exciting developments in how we interface with synthetic intelligence. It’s the difference between reading a spreadsheet of coordinates and looking at a topographical map.
Today, we’re going to walk through what Context Graphs are, why they are suddenly everywhere, and how they might just be the missing link between "smart" AI and "trustworthy" AI.
Grab a coffee. We have some ground to cover.
---
Part I: The Architecture of Context
To understand Context Graphs, we first need to agree on what we mean by "Context." In the human world, context is everything.
If I tell you "I saw the bank," the meaning changes entirely depending on whether I’m holding a fishing rod or a deposit slip. Humans process this effortlessly. AI, historically, has struggled. Large Language Models (LLMs) got better at this by ingesting massive amounts of text, but "Agentic AI"—AI that takes action in the real world—needs something more robust than just statistical probability of the next word.
Beyond the Static Knowledge Base
For years, we relied on **Knowledge Graphs**. You’ve likely used one today without knowing it. When you Google "Who is the director of Oppenheimer?" and it gives you a direct answer card, that’s a Knowledge Graph at work. It’s a static map of facts: *Christopher Nolan* --[DIRECTED]--> *Oppenheimer*.
These are great for trivia. They are terrible for decision-making.
The research report dropping this week highlights a critical distinction: **Context Graphs are dynamic.**
While a knowledge graph tells you what is true about the world *generally*, a Context Graph tells you what is true about the agent's world *right now*, and more importantly, how the agent perceives it.
Think of it this way:
- **Knowledge Graph:** An encyclopedia sitting on a shelf.
- **Context Graph:** A detective’s corkboard covered in photos, notes, and red string, updating in real-time as the case unfolds.
Nodes and Edges: The Syntax of Thought
At the technical level, Context Graphs utilize the same fundamental math as any graph theory application—nodes and edges. But what they represent is specific to the agent's operational reality.
**1. The Nodes (The Entities):** These represent everything the agent "knows" or "sees" at a given moment. This isn't just physical objects (e.g., "Red Car," "Pedestrian"). It includes:
- **Events:** "Detection of loud noise."
- **Concepts:** "Right-of-way."
- **Internal States:** "Confidence level: Low," "Goal: Merge Left."
- **Beliefs:** "Pedestrian intends to cross."
**2. The Edges (The Relationships):** This is where the magic happens. The edges define the *structure* of the reasoning. They explicitly link the nodes in ways that tell a story.
- **Causal:** "Rain" --[CAUSES]--> "Slippery Road."
- **Temporal:** "Check Mirrors" --[PRECEDES]--> "Turn Signal."
- **Inferential:** "Ball rolling into street" --[SUPPORTS]--> "Belief: Child may follow."
This structure allows us to capture the "multimodal" nature of modern AI. As noted in research drawing parallels to the **Visual Genome project (Krishna et al., 2017)**, we aren't just mapping text. We are mapping visual observations from cameras, audio data, and structured database info into a single, navigable web.
---
Part II: The Decision Trace
Here is where it gets interesting. The primary killer app for Context Graphs isn't just representing the world; it’s recording the history of the mind. The research refers to this as the **Decision Trace**.
In traditional software debugging, we have stack traces—a list of functions called before a crash. But a stack trace tells you *where* the code broke, not *why* the AI decided to go down that path.
A Context Graph provides a chronological, causal sequence of perceptions, reasoning, and choices. It creates a navigable record of the agent's "stream of consciousness."
Mapping the "Why"
Let’s go back to our braking autonomous taxi.
Without a Context Graph, we see: `Input: Image_Frame_892` -> `Output: Brake_100%`.
*With* a Context Graph, we can traverse the edges backwards from the action. It might look something like this:
- **Action Node:** "Apply Brakes"
- *Edge:* --[TRIGGERED BY]-->
- **Decision Node:** "Emergency Stop Protocol"
- *Edge:* --[MOTIVATED BY]-->
- **Belief Node:** "Obstacle in path"
- *Edge:* --[INFERRED FROM]-->
- **Observation Node:** "Visual Anomaly at Coordinates X,Y"
- *Edge:* --[ASSOCIATED WITH]-->
- **Knowledge Node:** "Pattern Match: Prone Human"
Suddenly, the error is obvious. The AI didn't just "glitch." It saw a reflection, matched it to the visual pattern of a person lying down (a "Prone Human"), and prioritized safety. The logic was sound; the perception was flawed.
This level of granularity is vital for **Explainable AI (XAI)**. As highlighted by researchers like **Carvalho et al. (2019)**, as AI integrates deeper into society, "interpretability" stops being a nice-to-have features and becomes a requirement. We need to be able to query the graph to ask specific questions about the agent's history.
The Role of PDDL and Planning
This isn't just about looking backward. It’s about how agents look forward.
The report references **PDDL (Planning Domain Definition Language)**, specifically work by **Fox & Long (2003)**. If you’re not a robotics nerd, PDDL is essentially a formal grammar for telling a robot what to do. It defines an initial state, a goal state, and the allowed actions to get from A to B.
Context Graphs ingest this planning logic. When an agent forms a plan, that plan becomes a subgraph.
- **Goal:** "Make Coffee"
- **Sub-goal:** "Boil Water"
- **Sub-goal:** "Grind Beans"
The agent can visualize the dependencies. "I cannot grind beans because I do not have beans." This missing node in the graph triggers a new goal: "Buy Beans." The graph becomes the workspace where the agent simulates the future before committing to it.
---
Part III: Building the Graph (How do we capture thoughts?)
You might be wondering: *"Okay Fumi, this sounds great, but where does the data come from? Do we have a tiny stenographer inside the CPU?"*
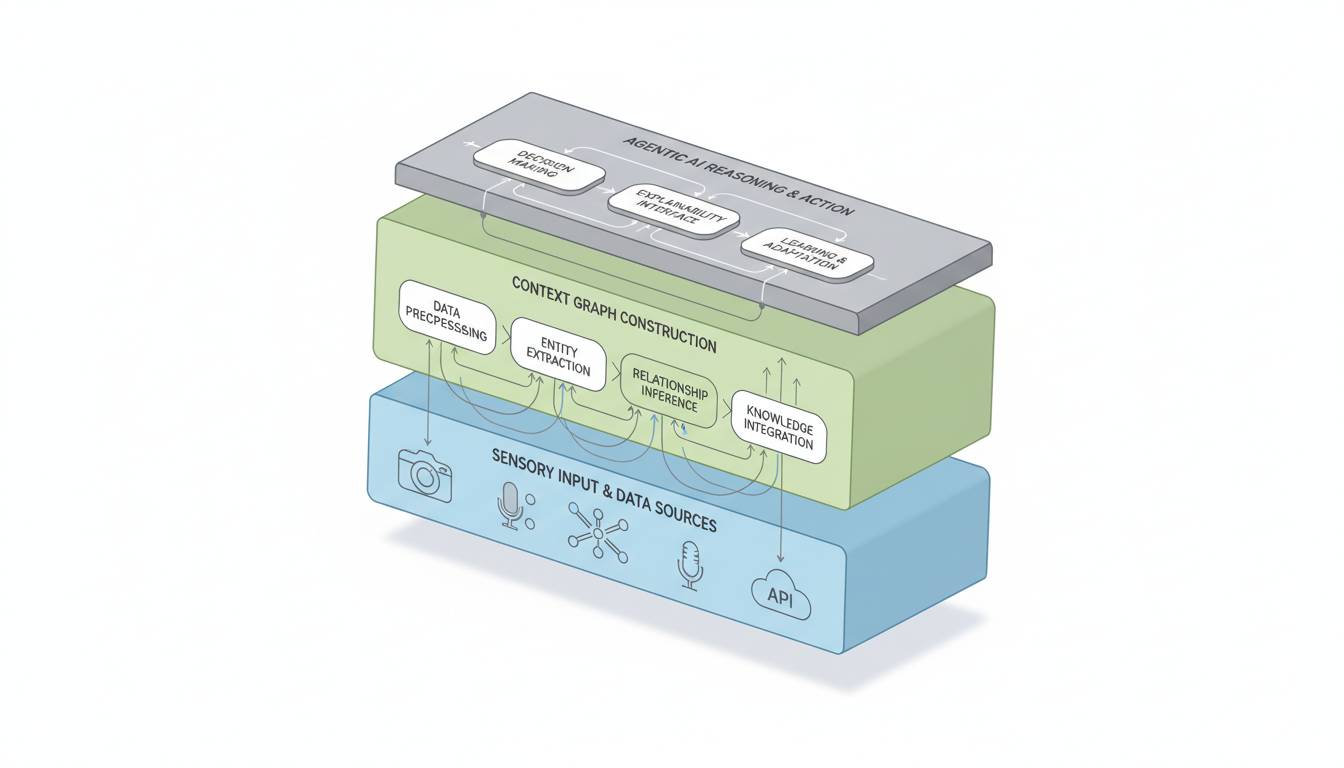
Not quite. But the methods for populating these graphs are fascinating in their own right. The research identifies a few key pipelines.
1. The Sensor Stream & Visual Genome
First, we have raw observation. Agents today are drowning in sensor data—LiDAR, cameras, microphones. We can't graph *every* pixel, or the graph would be larger than the universe.
Instead, agents use computer vision models to annotate the world, inspired by datasets like **Visual Genome**. They turn a stream of pixels into structured entities.
- **Raw Input:** 4K video stream.
- **Processed Graph Node:** Entity: "Traffic Light" -> Attribute: "Red" -> Spatial Relation: "Above Intersection."
2. Introspection and Logging
This is the "metacognition" layer. The agent’s reasoning engine (the software deciding what to do) explicitly logs its internal transitions.
If you're using a Reinforcement Learning (RL) model—the technique where agents learn by trial and error (famously surveyed by **Kaelbling et al., 1996**)—you are constantly dealing with states, actions, and rewards.
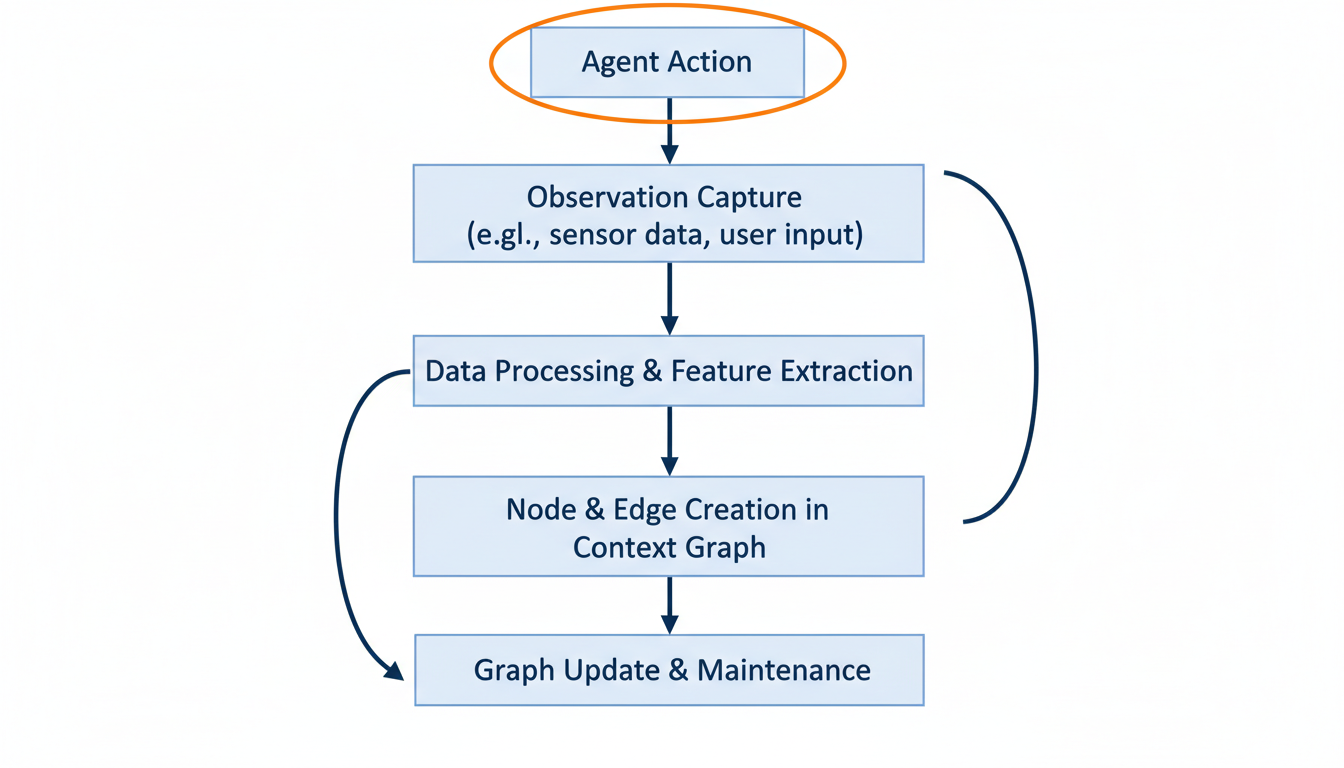
Context Graphs formalize this RL loop. Every time the agent updates its "value function" (its understanding of how good a specific action is), that update can be a node. We can literally see the agent learning.
- *Time T1:* Agent touches hot stove. Reward: -100.
- *Graph Update:* Create Edge: "Stove" --[CAUSES]--> "Pain."
- *Time T2:* Agent avoids stove.
3. The LLM Bridge
This is the modern twist. We are seeing a massive influx of **Natural Language Processing (NLP)** techniques being used to build these graphs.
Large Language Models are incredibly good at extracting structure from unstructured mess. An agent might read a user manual, a policy document, or a medical journal. Using LLMs, it can extract the rules and entities from that text and insert them into its Context Graph.
The report cites the work of **Singhal et al. (2023)** regarding encoding clinical knowledge. Imagine an AI doctor that doesn't just "know" medicine, but has built a specific graph of *your* medical history, linked to general medical knowledge, updated in real-time as you describe your symptoms. The LLM translates your spoken complaints into graph nodes.
---
Part IV: Why It Matters (The "So What?")
It’s easy to get lost in the abstraction of nodes and edges. Let’s ground this. Why should you, a human living in 2026, care about Context Graphs?
Because they are the infrastructure of accountability.
Healthcare: The Audit Trail
I mentioned the medical example above, but let’s drill deeper. AI in healthcare is controversial because the stakes are life and death. If an AI suggests a diagnosis, a doctor cannot simply accept it on blind faith.
With Context Graphs, the diagnostic process becomes transparent.
- **Node:** Patient reports dizziness.
- **Node:** Lab result shows low iron.
- **Inference Edge:** Low iron --[POSSIBLE CAUSE OF]--> Dizziness.
- **Conflicting Node:** Patient taking iron supplements.
- **New Inference:** Check for absorption issues.
A doctor can look at this graph and say, "Wait, the AI missed the interaction with Medication B." They can spot the flaw in the logic, not just the final result. It transforms the AI from an oracle into a colleague who shows their work.
Finance: Beyond the Black Box Algorithm
Algorithmic trading and fraud detection have long been dominated by opaque models. "Computer says no" is a frustrating reality for anyone who has had a credit card transaction declined while traveling.
Context Graphs allow for granular explanations of financial decisions. A fraud detection agent can map the transaction pattern:
- *Transaction A (London)* --[TIME GAP: 1 HOUR]--> *Transaction B (New York)*.
- *Inference:* Physical travel impossible.
- *Conclusion:* Card details compromised.
This provides a clear audit trail for regulators and customer support agents, who can actually explain to a client *why* their account was frozen.
Robotics & Manufacturing: The Collaborative Cobot
In manufacturing, robots are moving out of cages and working alongside humans. These "cobots" need to understand context to be safe.
A robot with a Context Graph doesn't just follow a script. It maps the environment. If a human worker steps into its path, the graph updates: "Obstacle detected." But more importantly, if the robot drops a part, it can trace the failure.
Was it a motor failure? Or did the lighting change, causing the vision system to miscalculate the depth? The graph holds the answer, enabling rapid error recovery and process optimization.
---
Part V: The Horizon (What we don't know yet)
We are still in the early days of this paradigm. While the report paints a promising picture, there are significant hurdles to clear before Context Graphs are the standard.
**1. The Scale Problem** Graphs grow fast. Really fast. If an autonomous vehicle logs every leaf it sees, the graph becomes unmanageable within minutes. We need better ways to "prune" these graphs—deciding what to remember and what to forget. This touches on the concept of **Catastrophic Forgetting** in AI; how do we keep the graph lean without losing vital long-term memories?
**2. Standardization** Right now, everyone is building their own graphs. A healthcare graph looks nothing like a finance graph. For agents to truly collaborate (e.g., your personal finance bot talking to your bank's fraud bot), we need shared protocols. We need the "HTML" of Context Graphs.
**3. Privacy and Ethics** This is the big one. A Context Graph is, by definition, a surveillance tool of the agent's environment. If you have an AI assistant in your home, its Context Graph contains a detailed map of your life, your habits, your conversations, and how they relate to each other.
Securing these graphs is going to be a massive cybersecurity challenge. We need to ensure that the "decision trace" doesn't become a "privacy leak."
Final Thoughts
Context Graphs represent a maturity moment for AI. We are moving past the "move fast and break things" era into the "move deliberately and explain things" era.
By forcing AI to structure its reality and record its reasoning, we are building systems that are not just smarter, but more intelligible. We are giving the machine a memory we can share.
And personally? I find something almost poetic about it. In our quest to build artificial intelligence, we’ve circled back to one of the oldest human tools for understanding the world: drawing a map, connecting the dots, and trying to figure out how it all fits together.
Until next time,
**Fumi**
Source Research Report
This article is based on Fumi's research into Context Graphs. You can read the full research report for more details, citations, and sources.
📥 Download Research Report (Markdown)